9945 Switch Grass Lane, St. John, IN 46373, Dyer, Indiana, United States. - Hero Image
Property logo
9945
Switch Grass Lane
Dyer | Indiana

The Measure of

Tropical Style

View More
Menu
Better Homes and Gardens Real Estate Connections
Presented At
$929,900
Bedrooms
5
Bathrooms
4
Living
3,600
SQFT
9945 Switch Grass Lane, St. John, IN 46373, Dyer, Indiana, United States. - Photo 1
9945 Switch Grass Lane, St. John, IN 46373, Dyer, Indiana, United States. - Photo 2
9945 Switch Grass Lane, St. John, IN 46373, Dyer, Indiana, United States. - Photo 3
9945 Switch Grass Lane, St. John, IN 46373, Dyer, Indiana, United States. - Photo 4
Thumbnail 1
Thumbnail 2
Thumbnail 3
Thumbnail 4
9945 Switch Grass Lane, St. John, IN 46373, Dyer, Indiana, United States. , Dyer , Indiana 46373

9945 Switch Grass Lane, St. John, In, 46373

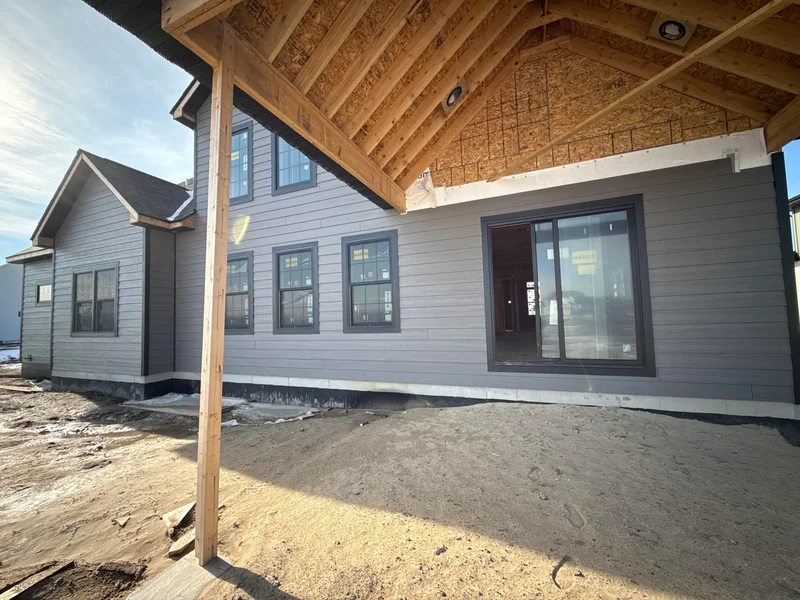
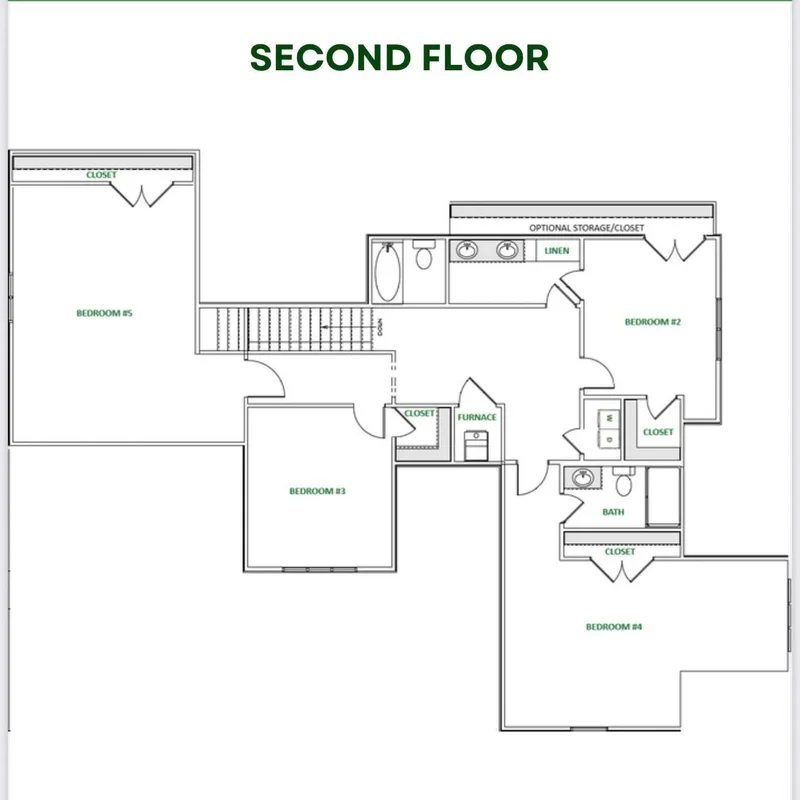
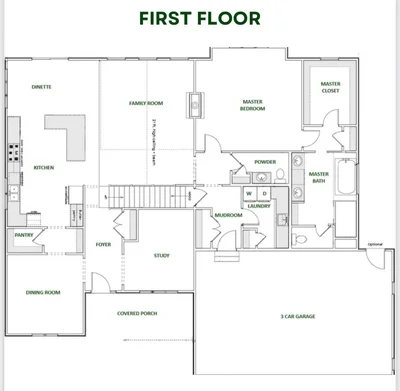
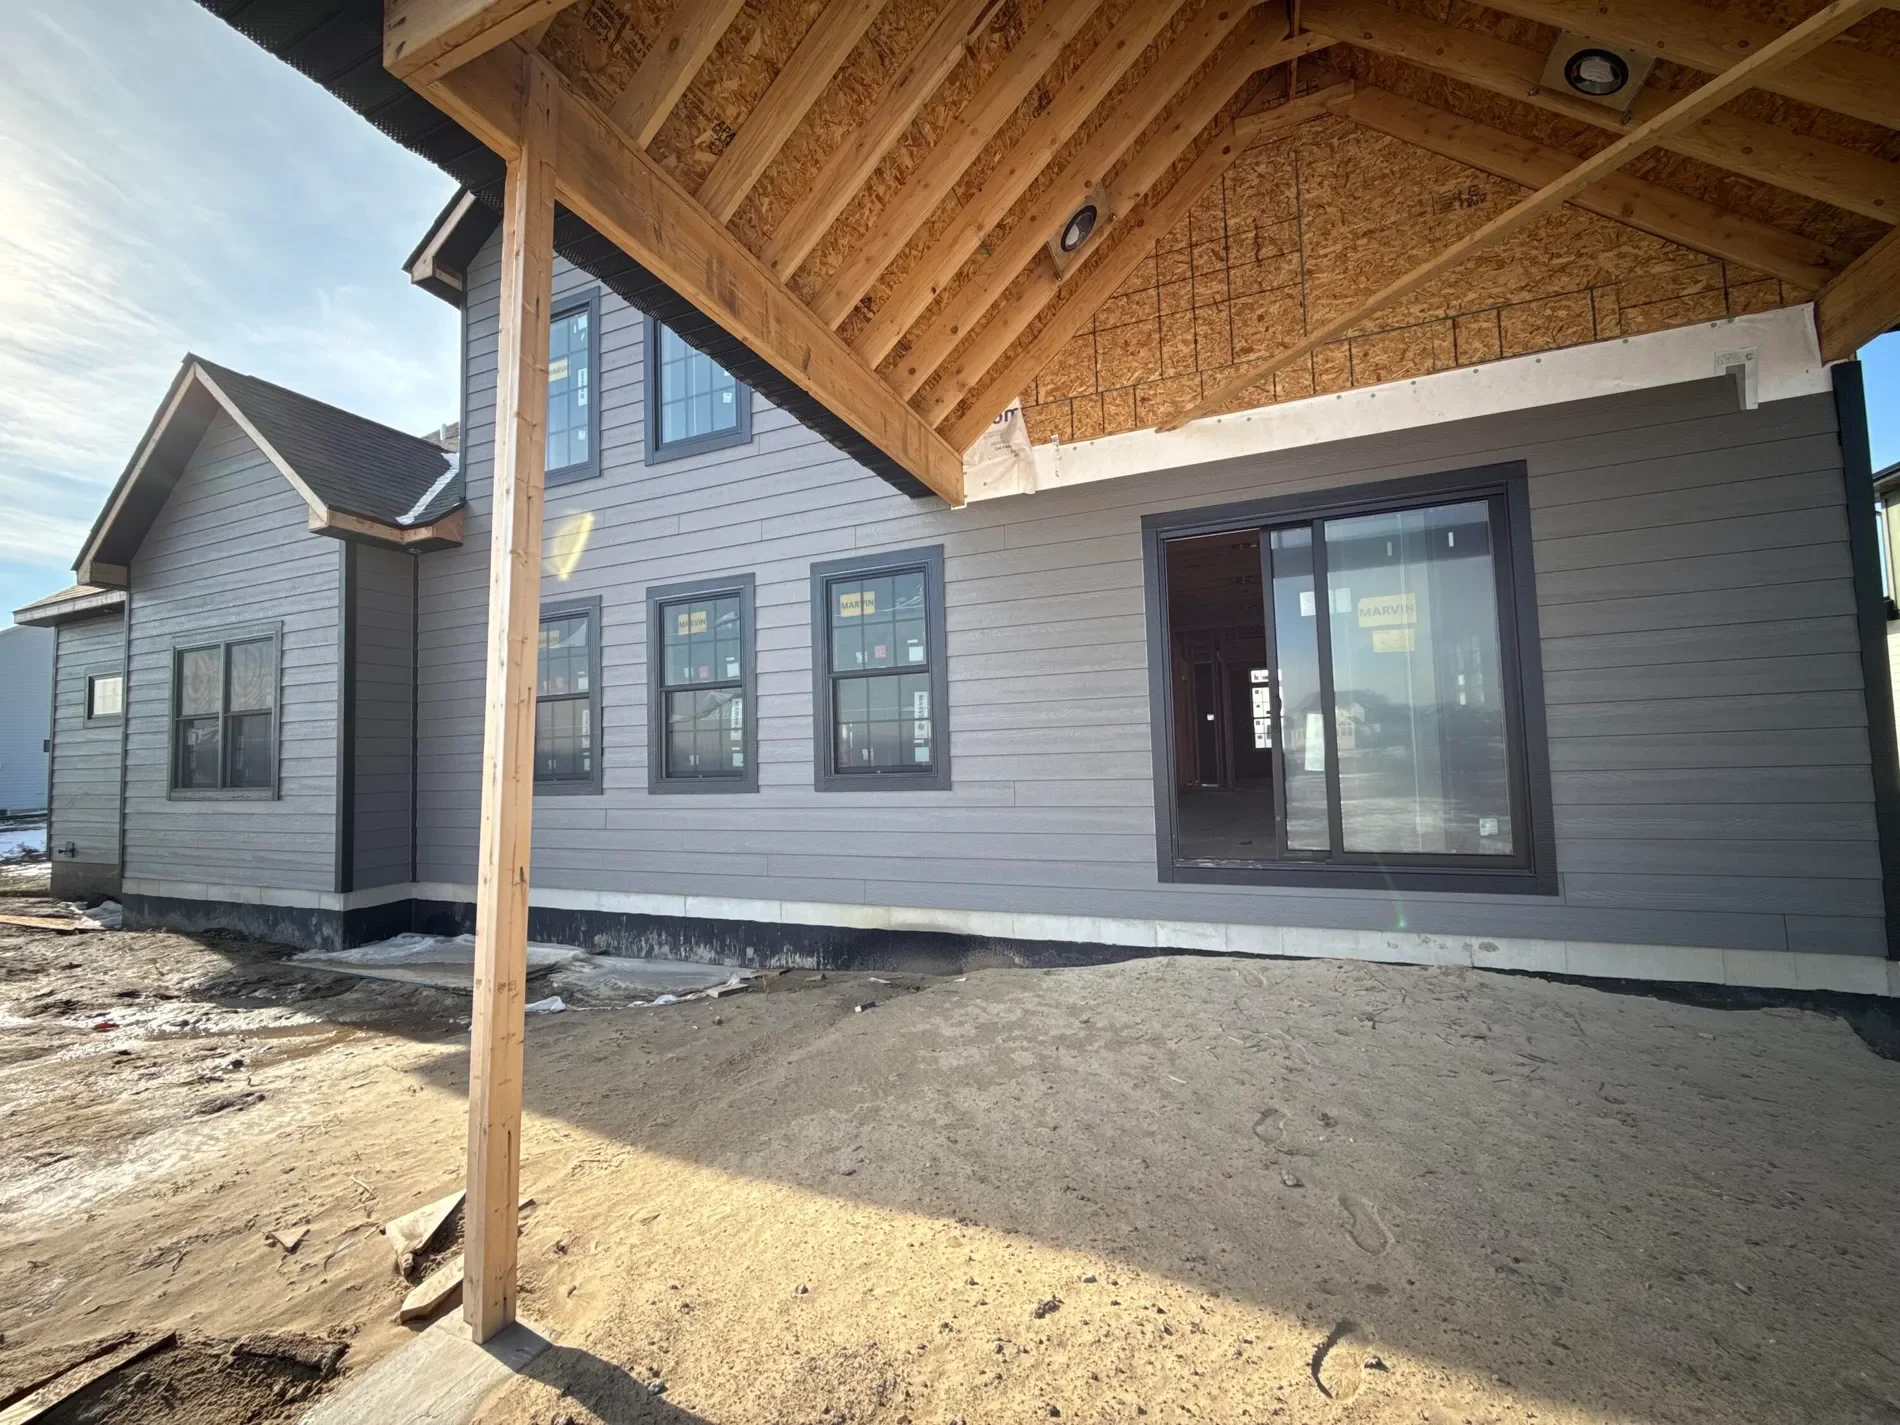
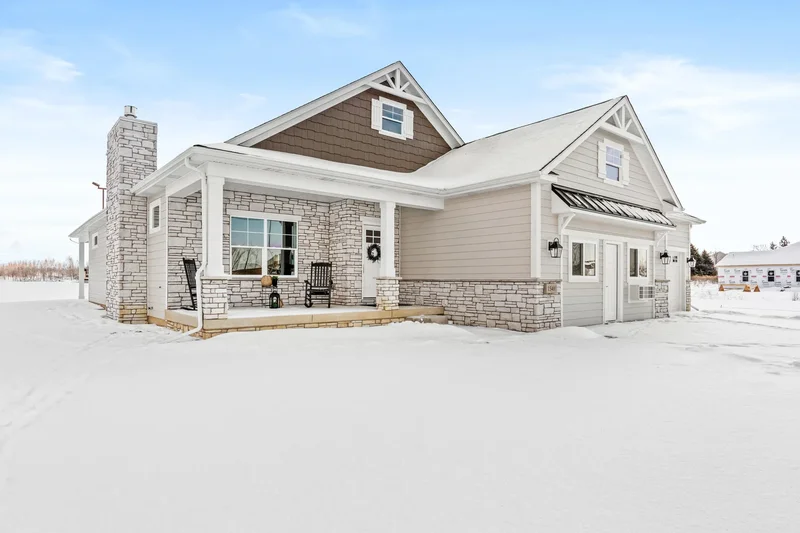
Welcome to this brand-new, thoughtfully designed new construction home located in the desirable Preserve community, offering a short distance to I-394 with convenient access to Chicago. This impressive 1.5-story residence features 5 bedrooms and 3.5 bathrooms, with a rare and flexible layout that includes a primary suite on both the main level and the upper level--ideal for multi-generational living or guests. The heart of the home is the stunning family room with soaring vaulted ceilings and a cozy fireplace, creating a warm and inviting space for everyday living and entertaining. The main-level primary suite is a true retreat, complete with a private fireplace, spa-like en-suite bath featuring a walk-in rain shower, dual vanities, and a spacious walk-in closet. Additional main-level highlights include a dedicated office or study, formal dining room, walk-in pantry, butler’s pantry, and a well-appointed kitchen with a large center island, dinette area, and open flow to the family room. The main level is rounded out with a mudroom, laundry room, powder room, and direct access to the garage. Upstairs, you’ll find four additional bedrooms, including two with private en-suite bathrooms, along with a convenient second laundry room. Currently in the framing stage, this home offers the excitement of new construction with an estimated completion date of March 2026--perfect timing to plan your move and personalize finishing touches. Don’t miss the opportunity to own a stunning new home in a prime location that blends luxury, space, and accessibility.

Property

3D Street View Tour

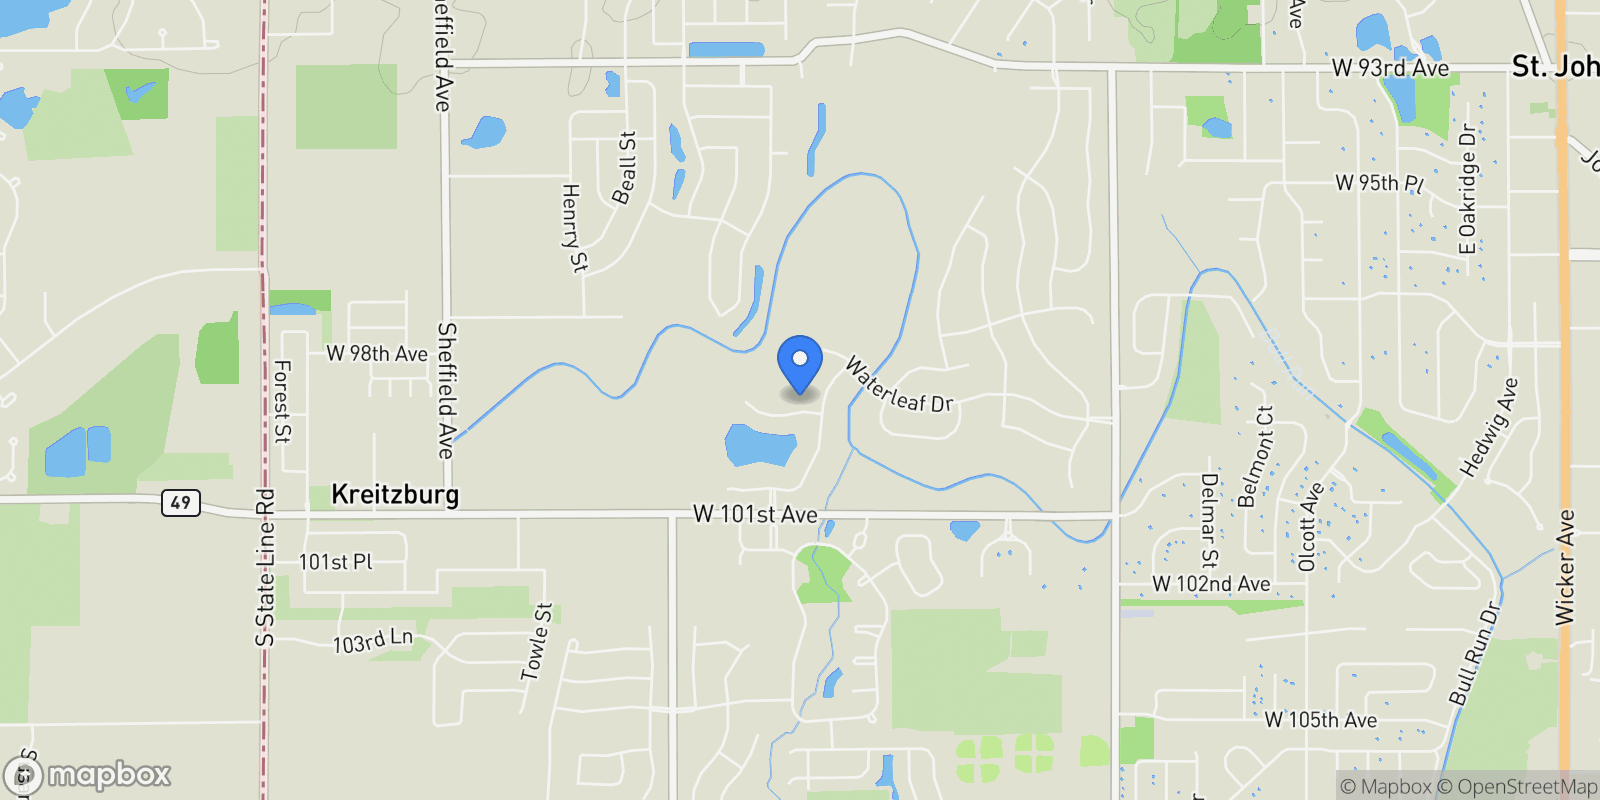
Map showing 9945 Switch Grass Lane, St. John, IN 46373, Dyer, Indiana, United States.

Property Location

9945 Switch Grass Lane, St. John, IN 46373, Dyer, Indiana, United States., Dyer Indiana

Local Weather & Climate

Dyer, Indiana

Current Conditions Updated recently
44 °F
Clear sky
Feels Like 34°F
Humidity 67%
Wind 30 mph
Visibility 6.2 mi
Sunrise 12:05 PM
Sunset 11:53 PM
5-Day Forecast
Fri 13 Mar
Clouds
High 49°
Low 43°
Sat 14 Mar
Clouds
High 43°
Low 31°
Sun 15 Mar
Clouds
High 63°
Low 42°
Mon 16 Mar
Snow
High 62°
Low 22°
Tue 17 Mar
Clouds
High 24°
Low 13°
Data from OpenWeatherMap

Walkability & Transit Scores

How easy is it to get around Dyer?

Walkability and transit scores for this address come from the EPA National Walkability Index.

Mortgage Calculator

Estimate your monthly payments for this property

$
%
$100,000
%
Estimated Monthly Payment $3,160
Monthly Payment Breakdown
Principal & Interest $2,528
Loan Amount $400,000
Total Interest $337,621
Total Cost $737,621
Potential Tax Benefits (United States)
$0 Est. First Year Interest Deduction
$0 Est. Annual Tax Savings
*Based on post-2017 tax law. Actual deductions depend on filing status, itemization, and current tax laws.

Ready to explore financing?

Connect with trusted mortgage partners

Important Information
  • This calculator is for illustrative purposes only and does not constitute a loan offer, pre-approval, or commitment to lend.
  • Monthly payment estimates do not include property taxes, homeowner's insurance, HOA fees, or other applicable costs which may significantly increase your actual payment.
  • Interest rates shown are for demonstration only. Actual rates depend on your credit score, down payment, loan type, property location, and current market conditions.
  • This tool provides estimates only. Consult with a licensed mortgage professional for accurate quotes and personalized advice.
  • Tax benefit calculations are simplified estimates based on general assumptions for United States. Actual deductions depend on your specific tax situation, filing status, and current tax laws.
  • Tax Year Information: Tax data shown is based on United States tax year 2025 (fiscal year: January-December), rules effective from 2018 through 2025. Tax laws change frequently and may have been amended since this data was compiled.

Market Opinion

Ultra Luxury 195.6× median

Our perspective on current market conditions in Dyer. For informational purposes only — always consult a licensed real estate professional before making decisions.

Consider Waiting
Market favors sellers. Patience may pay off.
43
Buyer Score
Prices are up 11.2% year-over-year

Local Market Price Trends

Median home sale prices in Dyer, Indiana — ZIP code 46373 over the last 24 months. This shows how property values in this neighborhood have changed over time, helping you understand whether the market is appreciating, stable, or cooling.

This property is listed at $92,990,000
Area median: $475,450
+11.2% year-over-year (well above the 3.5% historical avg)

Market Competition

42 days
Days on Market
Above typical
98.8%
Sale-to-List Ratio
Below asking

Future Value & Wealth Building

Starting investment: $929,900 20% down ($185,980)

14.4 years
Double Your Investment
Based on current market trends, your property value could double
$865,046
10-Year Equity
Your potential equity after 10 years of payments and appreciation
+$108,571
Appreciation Beats Rent
Potential gain vs 10 years of renting a similar home
$4,949
Monthly Investment
Estimated monthly mortgage payment (principal & interest)
$3,929,794
30-Year Wealth Potential
Total equity after full mortgage payoff with market appreciation
4.7x
Leverage Power
Your $185,980 down payment could grow to $865,046 in equity (10 yrs)
Investment Perspective
$ $ $
$1 → $1.62
Every dollar invested today could become $1.62 in 10 years
$100 → 162 $1,000 → $1,617
+$125
$125/day
Your home may appreciate while you sleep
$880/week $3,814/mo $45,765/yr
$100K Investment Comparison (10 Years)
Real Estate (Leveraged)
$408K
S&P 500 Index
$259K
High-Yield Savings
$155K
Real estate leverage: potential 57% advantage over stocks
RENT 💸 -$512K
vs
OWN 📈 +$865K
$865K Potential Equity
vs $512K lost to rent over 10 years
$186K Down Payment Growth
4.7x
10yr
$865K
10.8x
20yr
$2.0M
21.1x
30yr
$3.9M
Wealth Comparison
×9
Equivalent to 9 average US homes
top 5%
US household wealth ranking
Median: $193K Yours: $3.9M
Time to Double Your Investment (accounting for market cycles)
26.8
years
Conservative
2.62% effective/yr
12.1
years
Optimistic
5.91% effective/yr
Projected Home Values (adjusted for market cycles)
10 Years
Conservative $1.2M +30%
Market $1.5M +62%
Optimistic $1.7M +78%
$865K est. equity
20 Years
Conservative $1.6M +68%
Market $2.4M +161%
Optimistic $2.9M +216%
$2.0M est. equity
30 Years
Conservative $2.0M +117%
Market $3.9M +323%
Optimistic $5.2M +460%
$3.9M est. equity

Historical Market Context

How current appreciation compares to long-term averages

National Long-Term Average
4.27 %
1967 – 2024
57 years of U.S. home price data
Recent Decade Average
6.5 %
2014 – 2024
Post-recovery bull market
Above Historical
Current 5.8% appreciation exceeds the national historical average (4.3%). Market-based projections reflect current conditions that may moderate over time.

Projections account for historical market cycles (~12% corrections every 6 years). Effective annual growth after corrections: 4.9%. Market scenario reflects current 5.8% YoY trend from Redfin (Apr 2026). These projections are estimates only and actual results may vary. Past performance does not guarantee future results.

Data from U.S. Census Bureau, World Bank, Zillow, and Redfin | Market data updated Apr 2026

Neighborhood Demographics

ZIP 46373 • 2022 ACS Data

17,741 Population
Median Age: 45.0
$117,632 Median Income
High
$351,700 Median Home Value
Rent: $897
38.5% College Graduates
Above Average

Housing

Homeowners 96.8%
Renters 2.8%
Vacancy Rate 0.4%

Employment

4.0% Unemployment
10.7% Work From Home

Education Attainment (Age 25+)

High School+ 94.1%
Bachelor's+ 38.5%
Graduate+ 12.6%
Data from U.S. Census Bureau American Community Survey 2022

Frequently Asked Questions

Common questions about this property

This house at 9945 Switch Grass Lane, St. John, IN 46373, Dyer, Indiana, United States features 5 bedrooms with 3,600 square feet of living space.
This property offers 3,600 square feet of living space.
This property is listed at $92,990,000, which equals $25831 per square foot.
In Dyer, home prices have increased 11.2% over the past year, homes typically sell within 42 days, it's currently a unknown. These market conditions can affect pricing strategies and negotiation opportunities.
Based on current market indicators, Dyer shows an active market. The market opportunity score is 43 out of 100, reflecting factors like price trends, inventory levels, and days on market.
This is a house located in Dyer, Indiana. The property is situated in an established neighborhood with convenient access to local amenities and services.
Better Homes and Gardens Real Estate Connections

Better Homes and Gardens Real Estate Connections

Better Homes and Gardens Real Estate Connections

View Full Profile

Schedule a Tour

Get in touch with our listing agents

SunMonTueWedThuFriSat

More Listings

Explore more properties

Official Real Estate Games

Have fun discovering more properties while playing our real estate games — win prizes for ranking high!

$
$
$
$
$
$
$
WIN CREDITS
Up Your Real Estate Skills FOR FREE

Loading listings...